Calculation of CO2 offsetting
In the 18 years since its founding, Encon has had a multitude of successful projects under its belt and has supported many companies in their efforts to make their activities more sustainable. This page details how Encon calculates the impact of its role in the business world in terms of CO2 offsetting and tree savings.
CO2, or carbon dioxide, is one of the most important greenhouse gases. Trees extract CO2 from the air and convert it into oxygen and plant material via photosynthesis. Photosynthesis is the process of plants converting water and carbon dioxide into glucose (C6H12O6) and oxygen using sunlight.
- 6 CO2+6 H2O C6H12O6+6 O2
Trees absorb water from the soil with their roots. Carbon dioxide and oxygen are exchanged with the air through stomata in the leaves. The resulting glucose is converted into other compounds, such as cellulose and starch.
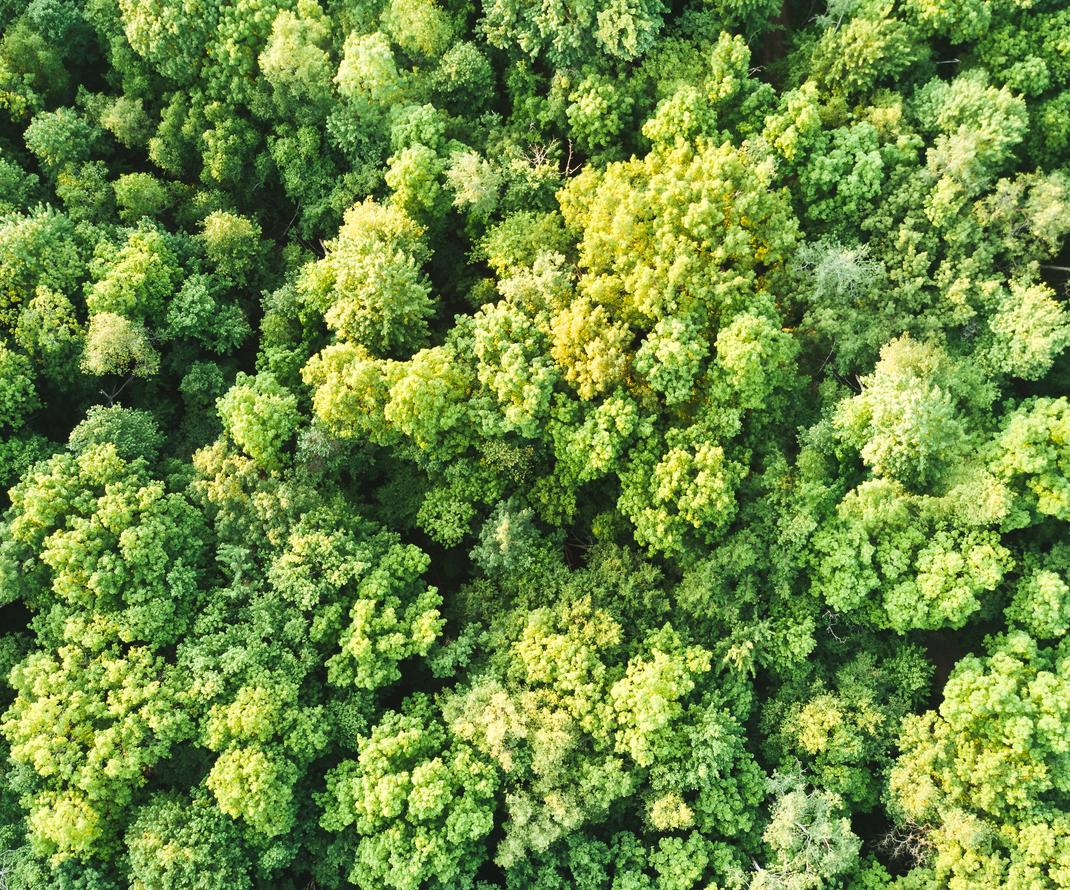
Compared to other vegetation, trees have the largest net oxygen production as they convert a large part of the CO2 into wood and roots. The CO2 fixation is therefore considerably higher in forests than in pastures or fields, which means they can offset part of the CO2 emissions.
CO2 offsetting by trees
The CO2 balance of trees varies greatly depending on the type of tree, location, season and periods with the same climate or weather. There have been numerous scientific studies on how CO2 offsetting can be determined.

To summarise the various studies, it can be concluded that annual CO2 offsetting ranges from 21.77 kg CO2/tree to 31.5 kg CO2/tree. This means that one tonne of CO2 can be offset by 31 to 46 trees. Europe has 300 to 500 trees per hectare. The calculation for the figures on the Encon website is based on 24 kg CO2/tree and an average of 500 trees per hectare. For 1 hectare of forest, this means: 500 trees x 24 kg CO2/tree = 12,000 kg CO2 offset or 12 tonnes CO2/hectare.
Every year since 2004, Encon has been calculating the savings resulting from the measures implemented after conducting energy studies, launching energy-saving projects and producing renewable energy. The savings are analysed for each project with a calculation and analysis of the yield. The following figures are used to calculate the conversion factors:
- 1000 kWh Electricity: 270 kg CO2
- 1000kWh of gas: 181 kg of CO2
- 1L fuel oil: 2.66 kg CO2
Important to note here is that the emission factors for electricity change from year to year, e.g. a nuclear reactor that has been out of operation for a long time, growth in PV capacity, the temporary use of an old coal or gas plant to make up shortfalls, and so on. The Vlaamse Milieumaatschappij (Flanders Environment Agency) closely monitors these emission factors and reports them to the public. The graph below shows the evolution of these emission factors. Whereas we calculated an emission factor of 400 kg CO2 per 1000 kWh of electricity in 2004, a more representative value in 2020 would be 270 kg CO2 per 1000 kWh of electricity. As the energy transition within Belgium is in full swing, we expect it to change in the coming years. We hope to continue the downward trend.
The calculation of the various savings is based on the assumption that the technical installations and renewable energy production (PV installation and wind turbines) have a service life of 20 years. This means the energy savings and renewable energy production for a period of 20 years are included in the calculation of the annual CO2 savings.